


What do oil prices do to the US economy?
Economic models as effective means of storytelling

Welcome. Today’s post answers an interesting practical question about the economy, but also argues for a much more important point: economic models are means of telling a story. Models allow us to go beyond words and explore the world through data, numbers and charts.
As we explore this new world of GenAI, where words are randomly sourced and concatenated automatically into persuasive arguments, how can we tell the information we search for is accurate? We have to see it in the data, and this is what we are going to do today. As usual, find a spreadsheet link to support you through the steps of what I have done from beginning to end.
So what do oil prices do to the US economy? Why should we care?
Well, answering the second question is much easier than the first. International oil prices are very volatile, having fallen by half and/or doubling in a single year many times through the course of the last three decades.
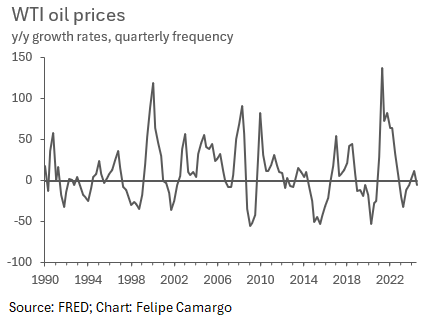
Although this is slowly changing, oil fuels many of the world’s most relied on technology, from fossil fuel vehicles for transportation of goods to basic LP gas for household heaters and cooking. We deal with it everyday, and its price puts a cost to how much we can do of these most basic activities. So in short this is about an important international input we have very little control of, but affects us heavily by its overwhelming variation over time.
And why is the second question more difficult (and interesting)? Because some countries, like the United States, are net exporters of petroleum.

Does that mean that when international oil prices go up the US stands to cash in a net benefit, as it will export its oil surplus and make more dollars from equal quantities of oil barrels sold? Interestingly so, it won’t. Let me use a model to explain you why.
From oil to domestic prices, labour income and GDP
To connect all transmission channels sensibly, we need one of those VAR models we have previously used in this blog many times. This is how we will specify today’s model, in matrix form:
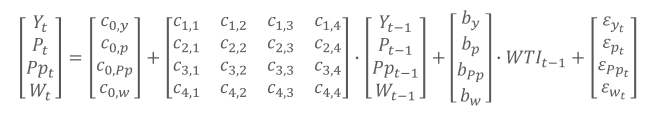
Using least squares to uncover our parameters, we have the following:

Next, we will want to study what happens to our system of equations when a temporary, although gradually fading, oil shock is introduced. Let’s try a 10% increase to oil prices.

There’s a whole story being told by our model that we need to unpack here, so taking it from top to bottom, left to right, we have:
First, our top left hand side chart shows how an oil price (WTI) increase passes through to producer prices (Pp), making production more expensive and squeezing firms’ profit margins;
Second, our top right hand side chart shows how firms let some of the rise in costs of production (Pp) pass through to consumer prices (P), as firms exercise their pricing power or simply produce less to keep production inputs affordable;
Third, on our bottom left hand side chart, we see nominal wages (W) attempting to follow an increase in consumer prices. Some sectors manage to get wage raises on par with inflation, while most don’t. This means the average hourly wage of the american worker shrinks in real terms, affording less goods. We also touched upon the wage-consumption relationship in a previous blog post;
Fourth (and last), GDP (Y) slows by only a share of what real wages do. While it is very easy to justify why the common sign of this impact (from lower household consumption and private investment), there are many potential explanations as to why GDP falls proportionally less.
Exports: As shown in the very beginning, the US has slowly shifted into a net fuel exporting economy over time. Fuel exporting firms may counterbalance the overall impact to GDP through a simple accounting identity to a degree.
Economic (mostly fiscal) policy: Policy aims to smooth economic contractions over time by providing spending/tax support in times of hardship. Fuel subsidies can, for example, partially offset the impact of lower real disposable income in times of oil shocks;
Labour market dynamics: firms will adapt to higher production costs in the smartest of ways. While addressing how to tackle cost increases, firms will often lay off some employees, trying their best to make it is the most efficient way possible and getting rid of weaker-performing employees first. While this bears no necessary effect to average wages, as most productive employees aren’t necessarily more expensive at the firm-level, it certainly bears significant effect at the aggregate output level. During Covid-19 for example, many economies saw their output/worker shares jump, as this “composition effect” in the labour market supported economies to recover faster from the pandemic trough.
Firm effects: here, similarly to labour market dynamics, a composition effect at the firm level also happens, where less productive firms go bankrupt and allow newer, more productive firms to emerge. Hard times make strong business.
Concluding thoughts
Quite an interesting story can be uncovered through only few equations. As we have seen, higher oil prices do more harm than good on average to the US economy. Most intuitively we want competitive firms costs to be as low as possible, as it will keep them less eager to let go of its employees or increase prices to consumers. Economic models are effective ways of illustrating and summarising stories, indeed.
This is it for today’s entry. Thank you for making it this far. If you enjoyed this content please don’t forget to like, subscribe and share.